Licensed Gaming Machine Trends: Q2 2026 Data Shows Operational Shifts Across Key International Markets
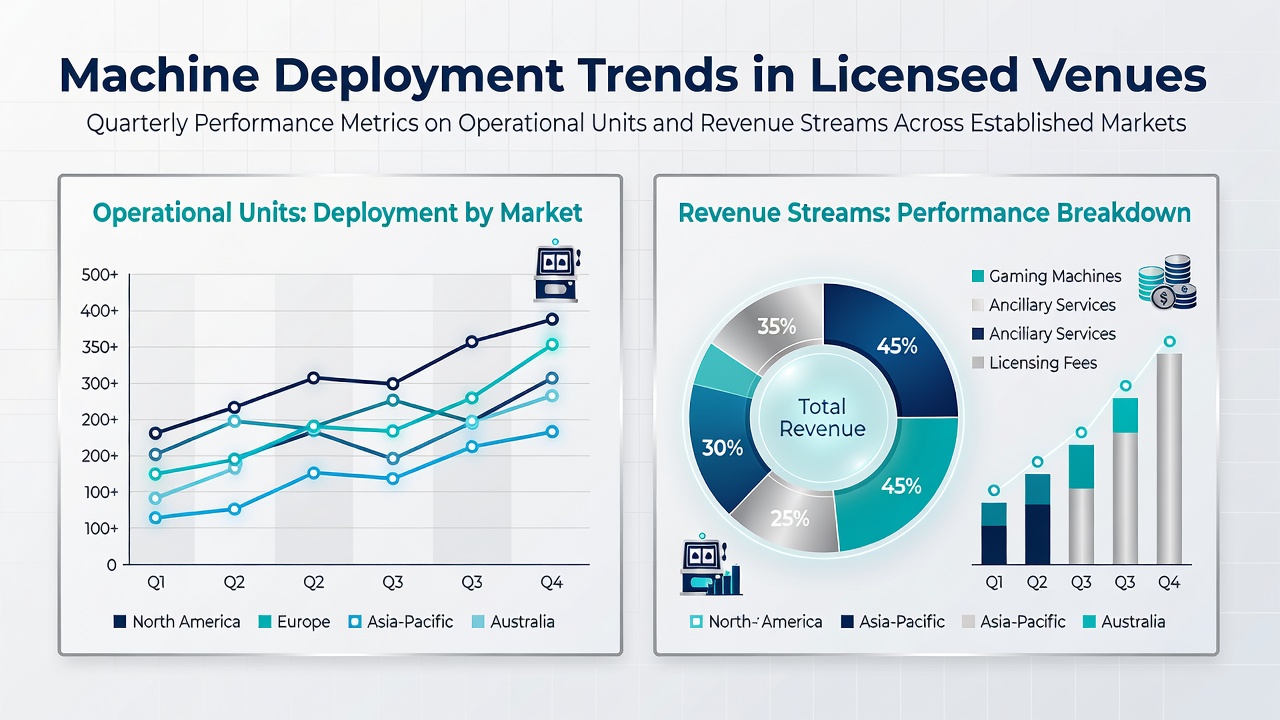
Markets across North America and the Asia-Pacific region posted measurable changes in gaming machine deployments during the second quarter of 2026, with operators adjusting unit counts while revenue streams reflected steady patterns in established venues. Data compiled from multiple jurisdictions indicate that total operational machines rose modestly in several US states, whereas Australian and Canadian facilities recorded targeted reductions in certain categories alongside revenue gains from higher-yield units.
North American Deployment Patterns
Nevada facilities increased their active slot and video lottery terminal counts by 1.8 percent between April and June 2026, according to figures released by the Nevada Gaming Control Board, which tracked 168,450 machines generating $3.92 billion in gross gaming yield. Operators concentrated additions in high-traffic Strip properties while trimming older models in regional casinos, a move that aligned with updated floor optimization strategies. Meanwhile, New Jersey and Pennsylvania venues maintained stable machine inventories yet reported revenue per unit increases of 4.2 percent and 3.7 percent respectively, driven by premium game placements and enhanced player tracking systems.
Canadian provinces presented a contrasting picture. Ontario operators reduced overall machine numbers by 2.1 percent during the same period, though average daily revenue per machine climbed 6.8 percent year-over-year, according to aggregated reports from the Ontario Lottery and Gaming Corporation. Facilities in Toronto and Ottawa redirected capital toward multi-game cabinets that support both traditional reels and skill-based bonus rounds, a shift observers note coincided with regulatory updates effective in late May 2026.
Australian and Broader Regional Metrics
Across Australia, New South Wales and Victoria together operated 92,300 gaming machines by the close of Q2 2026, down 1.4 percent from the prior quarter, while combined revenue reached AUD 1.84 billion. Venues in these states prioritized replacement of legacy units with newer models featuring linked progressive jackpots, which contributed disproportionately to total yield despite representing only 18 percent of deployed hardware. Queensland and South Australia followed similar patterns, with modest unit reductions offset by revenue stability in clubs and hotels that host community-focused gaming areas.
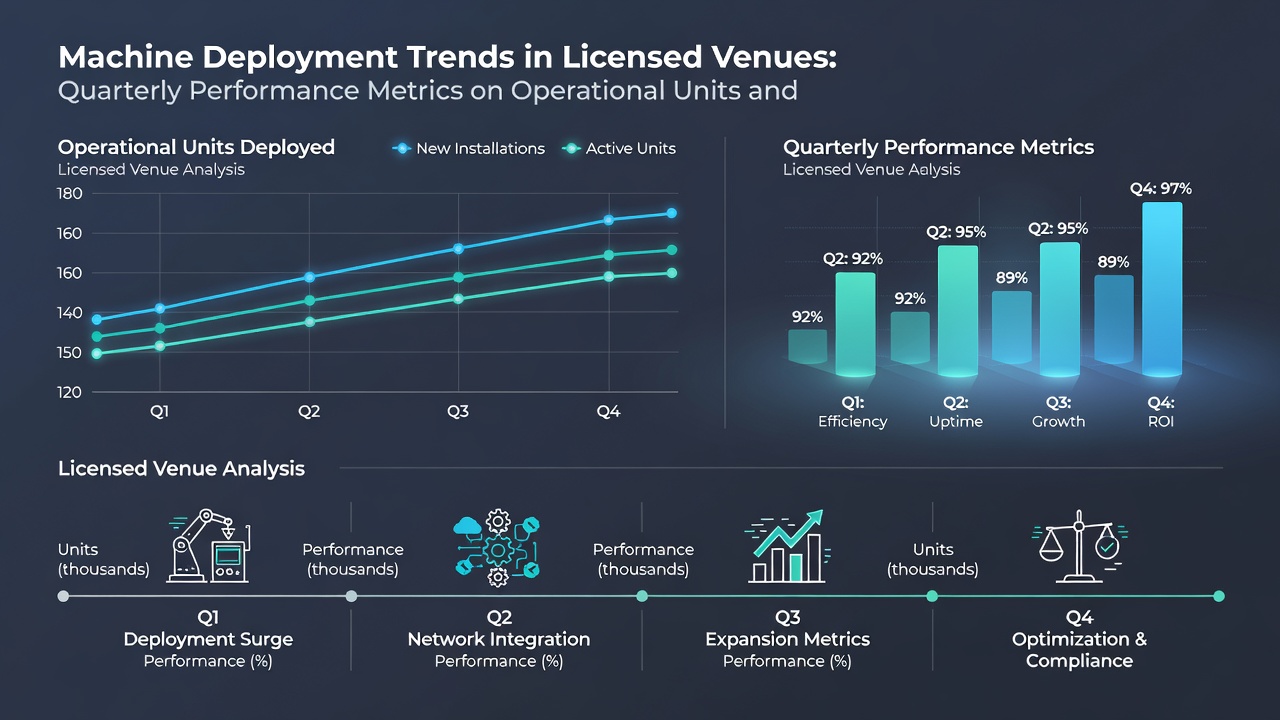
European markets outside the UK maintained consistent deployment levels, with operators in Spain and the Netherlands reporting flat machine counts yet recording revenue growth tied to seasonal tourism peaks that extended into early June 2026. Data from these regions show that integrated resort venues achieved higher utilization rates on electronic table games compared with stand-alone slot halls, prompting several chains to reallocate floor space accordingly.
Revenue Stream Analysis and Unit Efficiency
Across all tracked jurisdictions, revenue per operational unit averaged $23,400 for the quarter, a 3.9 percent increase from Q1 2026. Markets that introduced cashless payment options earlier in the year experienced faster transaction speeds and longer average session durations, factors researchers link directly to improved yield without corresponding increases in machine numbers. Industry analysts tracking these metrics note that venues emphasizing responsible play tools, such as session time limits and spend alerts, maintained comparable revenue figures to those without such features, suggesting operational efficiency rather than volume alone drives performance.
Take the case of several mid-sized US casino groups that consolidated machine footprints in secondary markets while expanding in primary destinations. These adjustments produced higher overall revenue despite fewer total units, a result attributed to concentrated marketing around high-performing game themes and updated loyalty program integrations. Similar consolidation occurred in parts of Atlantic Canada, where operators replaced multiple older terminals with fewer advanced cabinets that support both slots and electronic bingo variants.
June 2026 Context and Forward Indicators
By mid-June 2026, preliminary indicators pointed to continued emphasis on machine quality over quantity, with licensing applications in several US states focusing on technology upgrades rather than net additions. Regulatory filings reveal that operators increasingly cite data analytics platforms as central to deployment decisions, allowing real-time monitoring of unit performance across multiple sites. This approach enables quicker identification of underperforming assets and supports targeted refreshes timed to major sporting or entertainment events scheduled for the second half of the year.
Conclusion
Quarterly data from established markets demonstrate that machine deployment strategies continue to evolve toward efficiency-focused models, with revenue streams showing resilience even where unit counts remain stable or decline slightly. Operators in Nevada, Ontario, and Australian states illustrate how selective investment in newer technology and optimized floor layouts can sustain or improve financial outcomes without proportional expansion of hardware inventories. These patterns, documented through regulatory and industry reporting channels, provide a factual baseline for understanding ongoing adjustments in licensed venue operations as the 2026 calendar year progresses.